Objective: To allow users to view in a few clicks facts and data which best highlighted the Group's business in 2010.
Concerto designed, developed and integrated a "mini site" mapping in TOTAL Group's annual report.
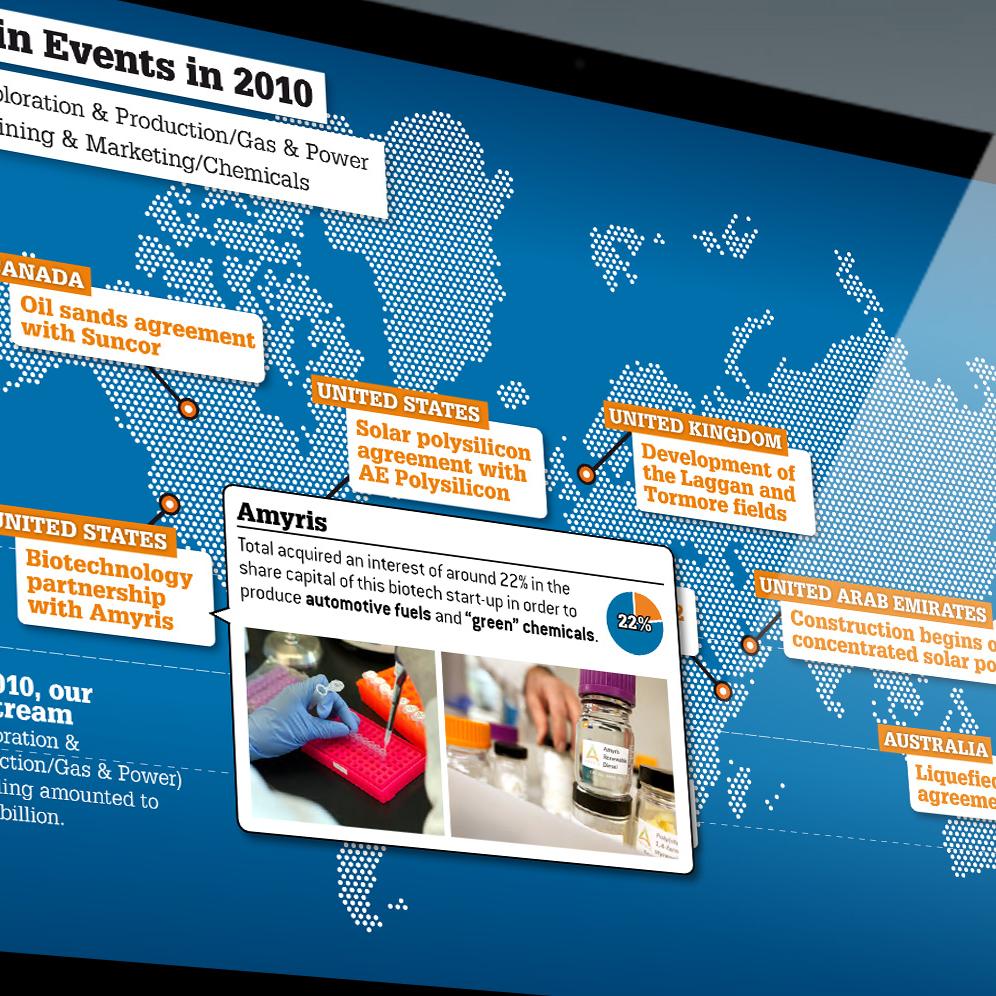
Different charts, illustrations and original maps provide a comprehensive view of all the achievements and projects of the Group.
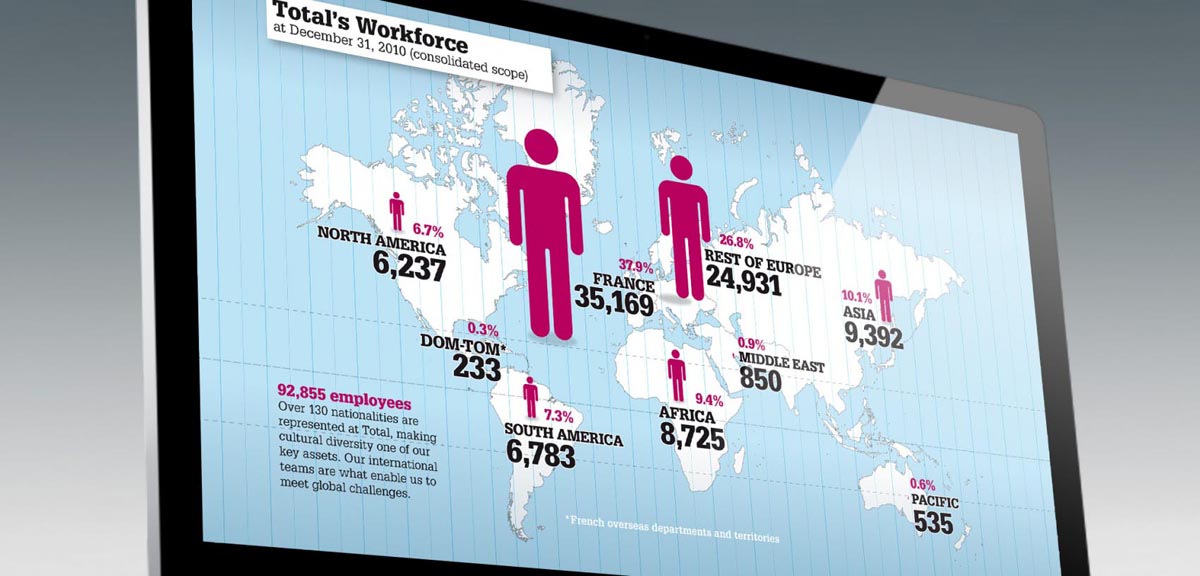
Via an interactive map, people immediately have a global view of data which is "instinctive" and particularly effective.
For example, to show the scale of the workforce in certain regions, the agency graphically illustrates human profiles in proportion to size. This puts complex data into a perspective that's easy to digest and compare.
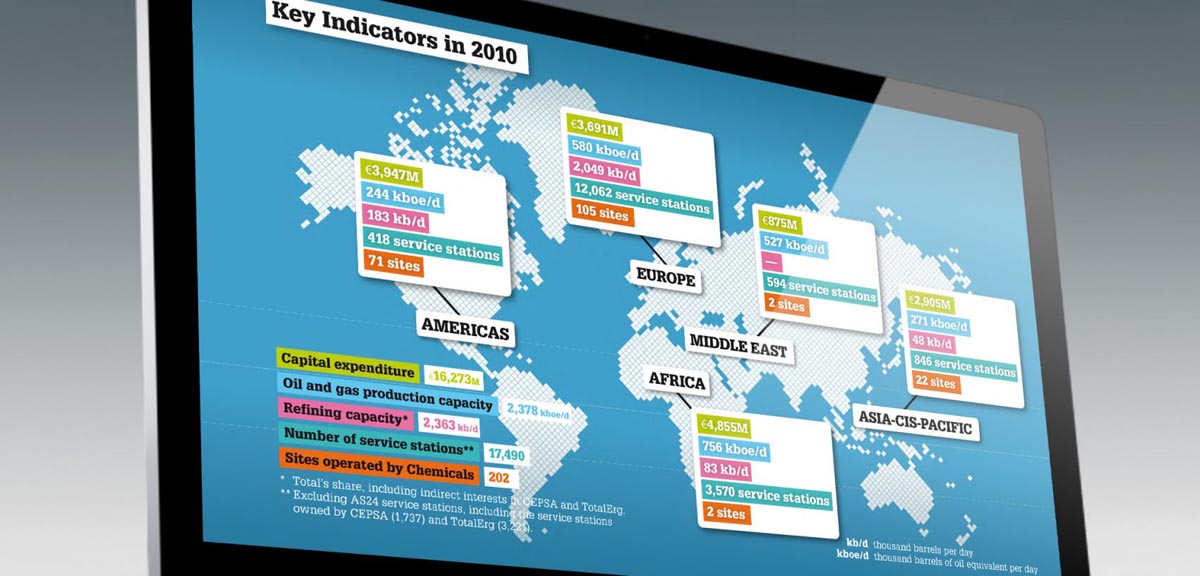
Block diagrams of key figures are used to capture multiple data in a glance. Through colour coding, all numbers listed on the map are clearly linked to a legend displaying the cumulative index.
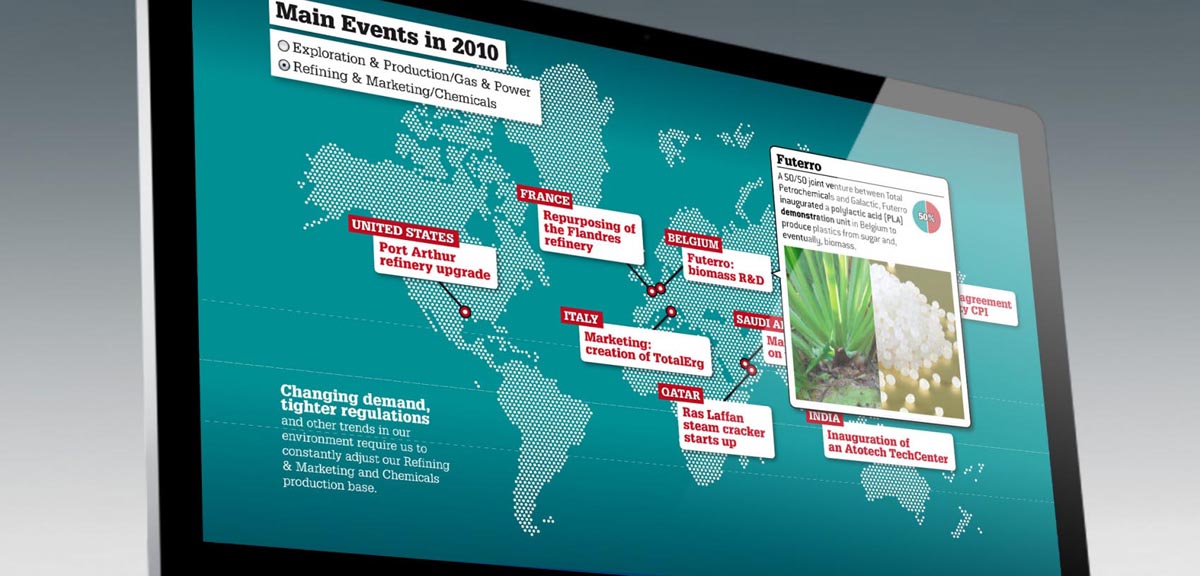
Highlights of Refinery and Marketing are located on a world map in the form of short and factual messages. A simple click on the message opens a "pop-up" explanation. A text box set in the lower left corner provides further insight into the strategy developed by the company.